
Local Services Ads revenue tracked in ServiceTitan, 12 months of 2025.

Named clients with the number each one needed to move, then the rest of the portfolio by trade and city.
Eight clients named, the rest by trade and city. We will screen-share the real accounts on a call.
Brands behind the numbers on this page








Every figure carries the period it covers, and the working behind it is on file.
Local Services Ads revenue tracked in ServiceTitan, 12 months of 2025.
August to October 2025, from $137K in Google and Microsoft spend.
In 30 days.
Lifetime value against customer acquisition cost, in 60 days.
In 35 days, across six brands on one dashboard.
In 90 days.
Led user acquisition through the Series D.
Demand generation and digital programs across the product line.
We open your ad accounts and CRM on the call, not a deck.
Book a call with DrewOne client per city, so nobody can infer that we work with their direct competitor.
268 leads in Q3 2026 against 110 a year earlier.
Read the storyClick to lead, 9.6% to 28.1% year over year.
Read the story$120 to $90, on more leads and less spend.
Read the storyEvery LSA call transcribed and labeled, April to October 2026.
Read the story440 conversions against 149, on 15% less spend.
Read the storyConversion rate 5.4% to 19.5%, on 34% less spend.
Read the story302 MQLs in a quarter, half of them accepted by sales.
Read the storyNothing in that category yet.
The specific changes behind each home services result.
They came to us reporting on clicks. We rebuilt conversion tracking so a lead meant a real call or form, then moved budget toward the services that actually booked. Everything after that was arithmetic.
Traffic was never the problem. We rewrote the landing experience, cut the search terms that never booked, and put every inbound call through classification so the team could see which calls were real.
Negative keyword work, a tighter geography, and bids driven by booked calls rather than form fills. No new channel and no bigger budget.
Local Services Ads charge per lead, so a junk call costs the same as a booked job. Every call goes through transcription and classification, and the junk ones go to the dispute queue instead of being quietly absorbed.
Category and funding stage only, with the CRM number rather than the platform number wherever we had it.
They were buying broad category terms that never reached the ICP. We cut those, rebuilt the account around the products with real pull, and let the budget follow.
Most of the gap was message match: the ads promised one thing and the page argued another. We rebuilt both around the use case buyers actually arrive with.
The number that mattered was the second one. A 50% MQL to SAL rate means the definition of a lead held up on the other side of the handoff, which is where most paid programs quietly fail.
If a figure cannot survive the question "compared to what, over what period", it does not belong here.
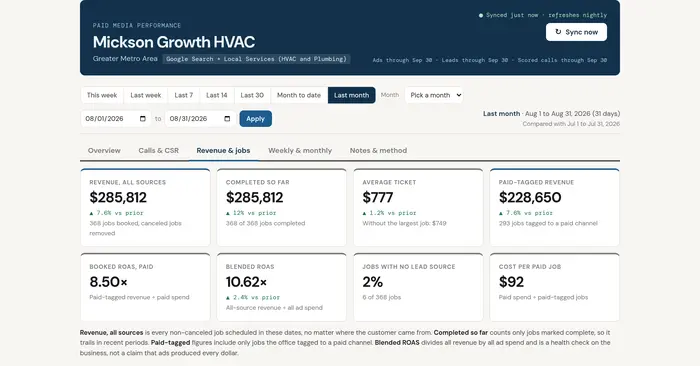
Four tests. A result that fails any one of them is not published.
We can open the account and show the same number on the same dates.
A figure without "compared to what, over what period" is not a result.
Programs we ran. Not a channel that happened to improve while we worked elsewhere.
Every card on this page can be opened live on a call.
Four things we do on every account, in this order, whatever the business is.
Nothing is optimized until a lead means a real call or form, joined to the CRM.
Spend follows booked jobs and opportunities, not platform conversions.
Every call scored, so the junk rate is a measurement rather than an argument.
A lead sales will not accept is not a result, so we track it through to the CRM.
The accounts, the conversion history and everything we build on top of them.
Thirty minutes, and we screen-share the accounts behind these cards.
For home services from $5M, PE-backed platforms, and B2B teams with a real ICP. If that is not you yet, we will say so.